The number of positive tests for coronavirus cases in Langley have increased by 59 per cent from July to August, according to the B.C. Centre for Disease Control.
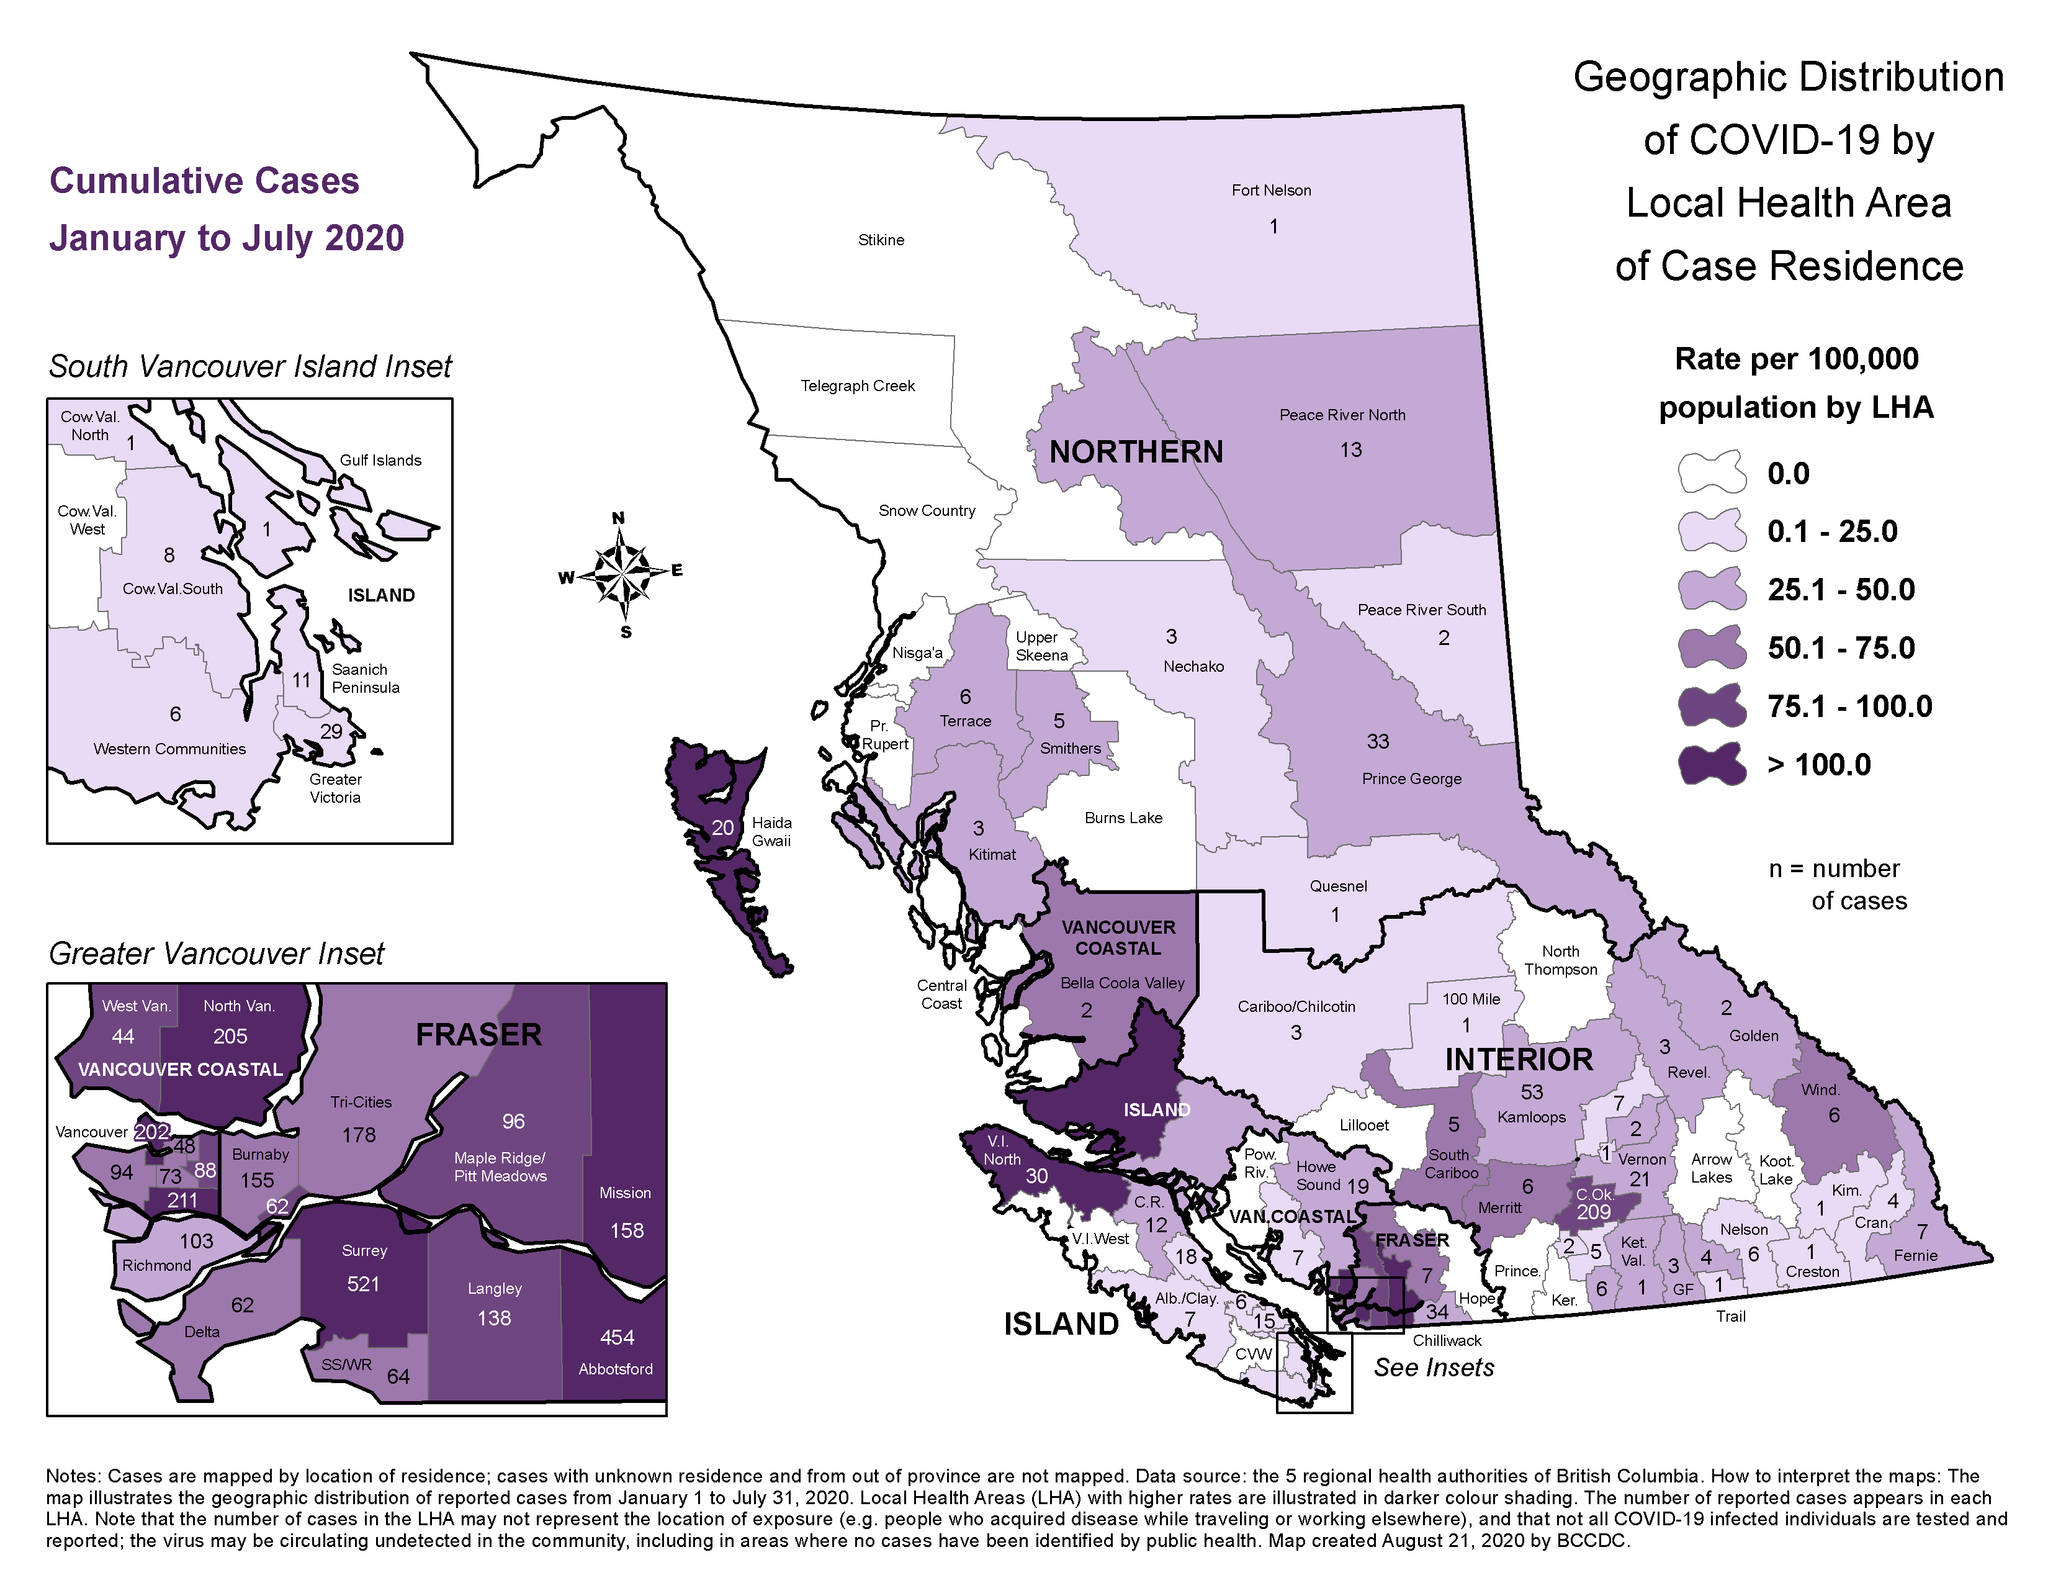
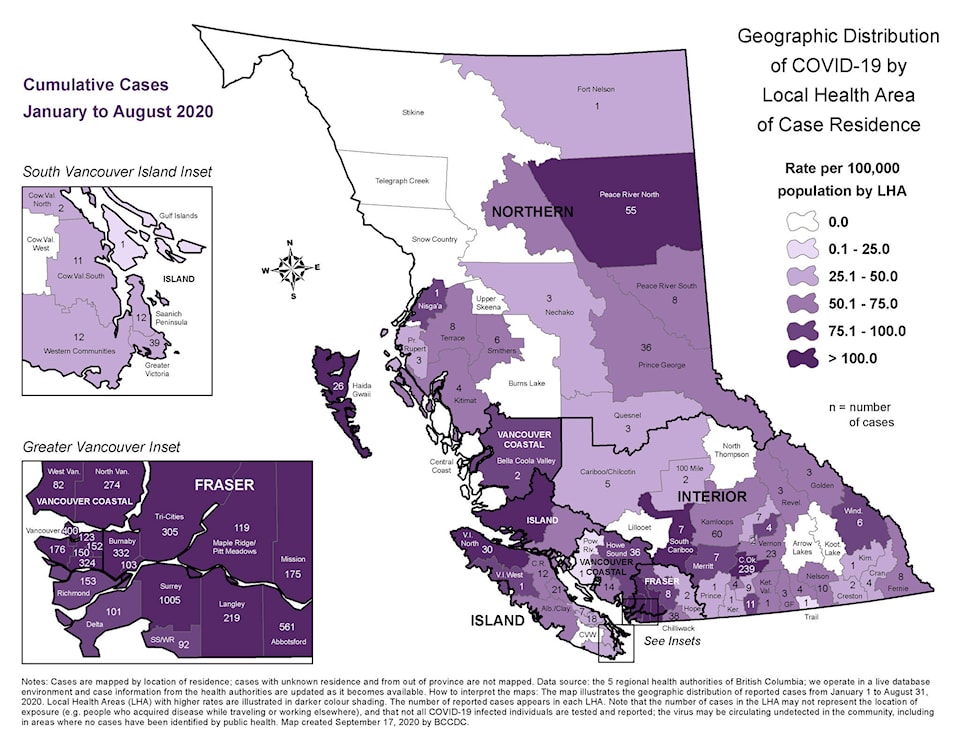
As of August 31, the number of reported cases increased to 219 from 138 in July, cumulatively, the provincial health authority reports.
READ MORE: Fraser Health announces increased hours and staffing levels for Langley COVID-19 testing centre
According to the most recently available census figures from 2016, the population of the Township was 117,285, while the City recorded 25,888.
However, Langley is still faring better than some of its neighbouring communities.
If you use an online portal like my ehealth or my health, you can get your COVID-19 test result as soon it becomes available. Learn how to sign up or access test results other ways: https://t.co/Bf7TsLWAVF pic.twitter.com/k5nsIZS6UC
— BCCDC (@CDCofBC) September 26, 2020
In Surrey, during that same cumulative period, the number of reported cases nearly doubled from 521 to 1,005 – a 93 per cent increase.
Surrey’s population was 517,887, according to 2016 census figures.
READ MORE: Health Canada green-lights rapid COVID-19 test
Meanwhile, in Abbotsford, the number of cases increased 454 to 561, cumulatively during that same period, a increase of 24 per cent.
Population is Abbotsford was 141,397, according to 2016 census figures.
The province releases a map of the numbers of test positive cases by geographic location in a number of communities on a monthly basis. Local health authorities with higher rates are illustrated in darker colour shading.
#COVIDBC update: 125 new cases since we last reported, for a total of 9,138 cases in BC. https://t.co/qfZhgUyyMG pic.twitter.com/41CXZjktDF
— BC Government News (@BCGovNews) September 30, 2020
On Wednesday, B.C.’s chief medical health officer Dr. Bonnie Henry reported 125 new cases, with 72 individuals in hospital with COVID-19, 21 of whom are in intensive case.
Since the start of the pandemic there have been 4,658 cases of COVID-19 in the Fraser Health region, the province reports.
@JotiGrewal_
joti.grewal@blackpress.ca
Like us on Facebook and follow us on Twitter.